A function for visualizing the relationship between words and terms within each topic
Examples
ldas <- SegmentR:::test_data(explore = FALSE)$lda
#> removing stopwords
#> Making DTMs
#> making tuning grid
#> setting up LDAs
ldas <- ldas %>% dplyr::filter(k == 3, freq_cutoff == 1)
data <- ldas$data[[1]]
ldas <- ldas$lda[[1]]
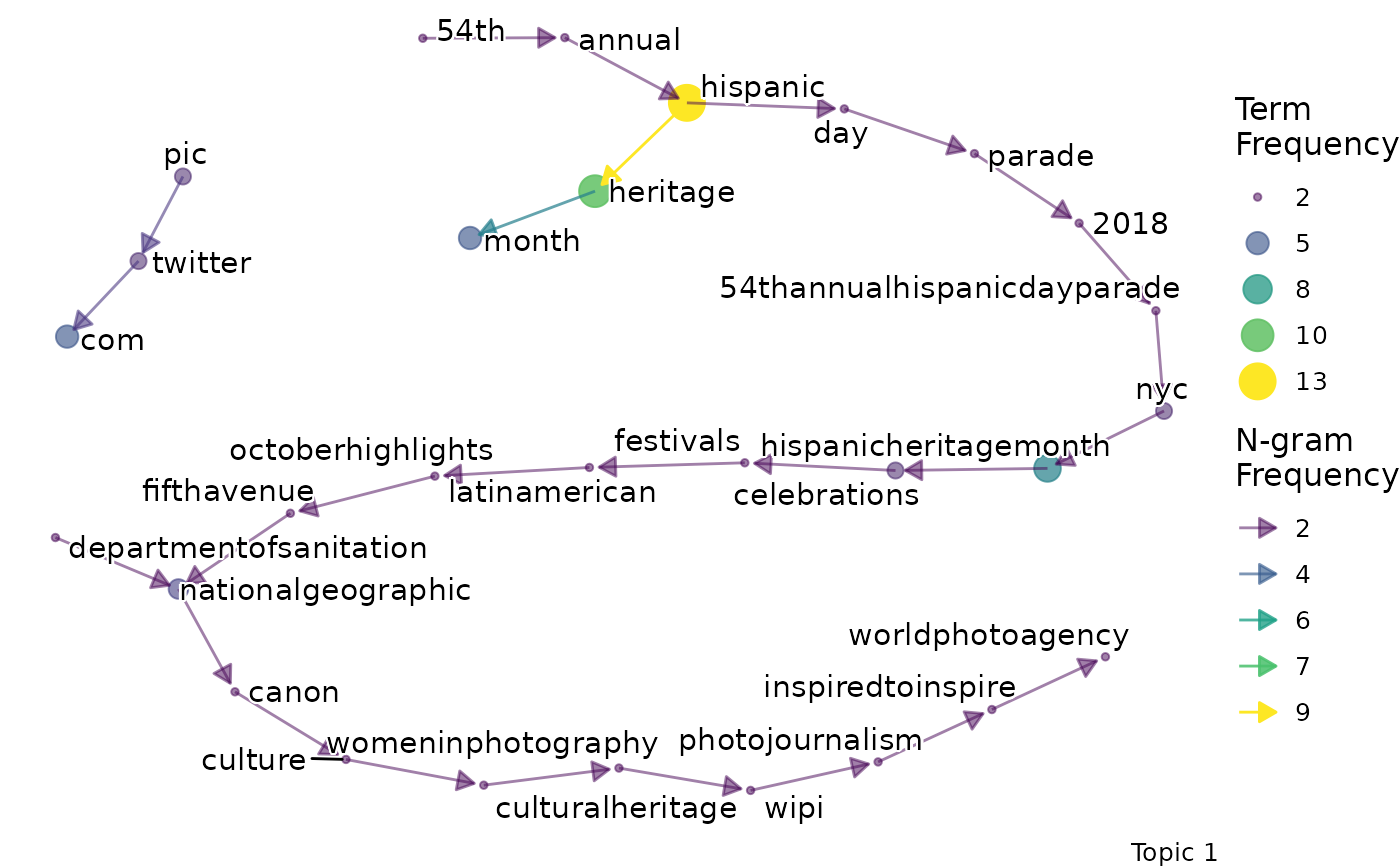
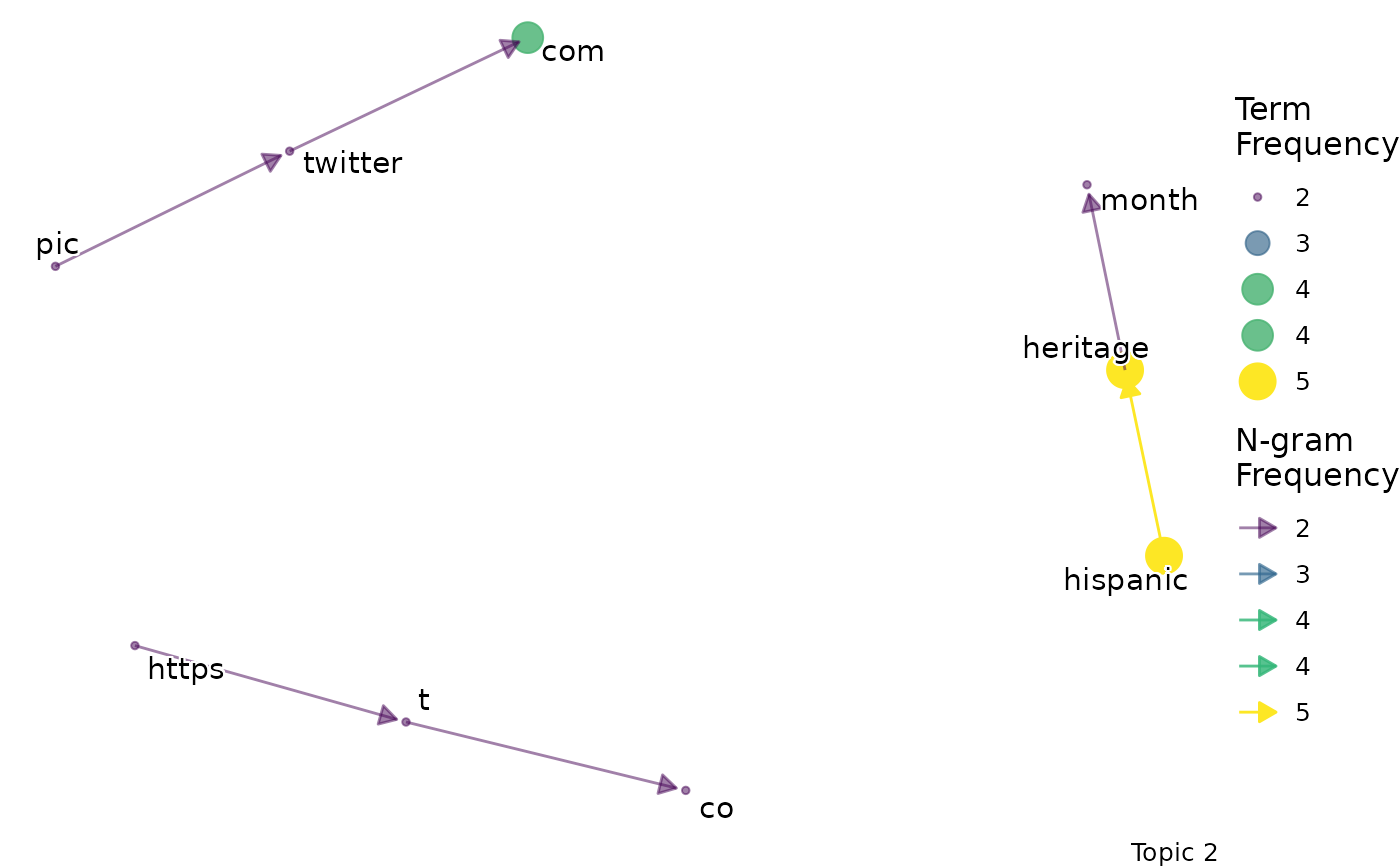
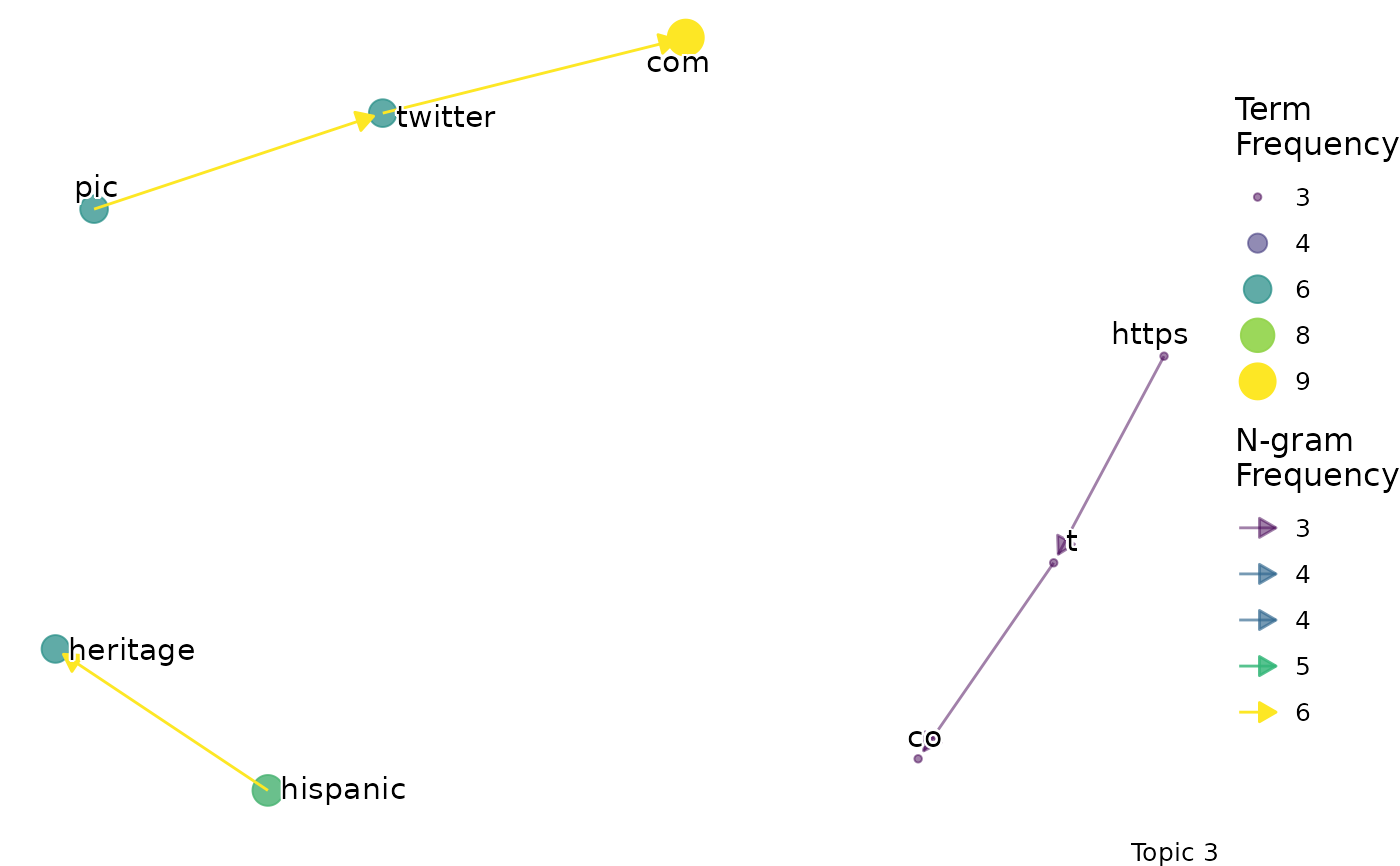
bigrams_segmentr(ldas, data, top_n = 5, min_freq = 2)
#> $topic_1_bigram
 #>
#> $topic_2_bigram
#>
#> $topic_2_bigram
 #>
#> $topic_3_bigram
#>
#> $topic_3_bigram
 #>
#>