This article provides examples of how the add_logo()
function can be used.
First, we’ll make an example plot to add our logos to using the
mtcars dataset. Let’s see how quarter-mile time,
qsec, varies with horsepower, hp:
test_plot <- mtcars %>%
  ggplot(aes(hp, qsec)) +
  geom_point() +
  geom_smooth() +
  scale_x_continuous("Horsepower") +
  scale_y_continuous("Quarter\nMile\nTime") +
  theme_minimal() +
  theme(axis.title.y = element_text(angle = 0, vjust = 0.5))

test_plot
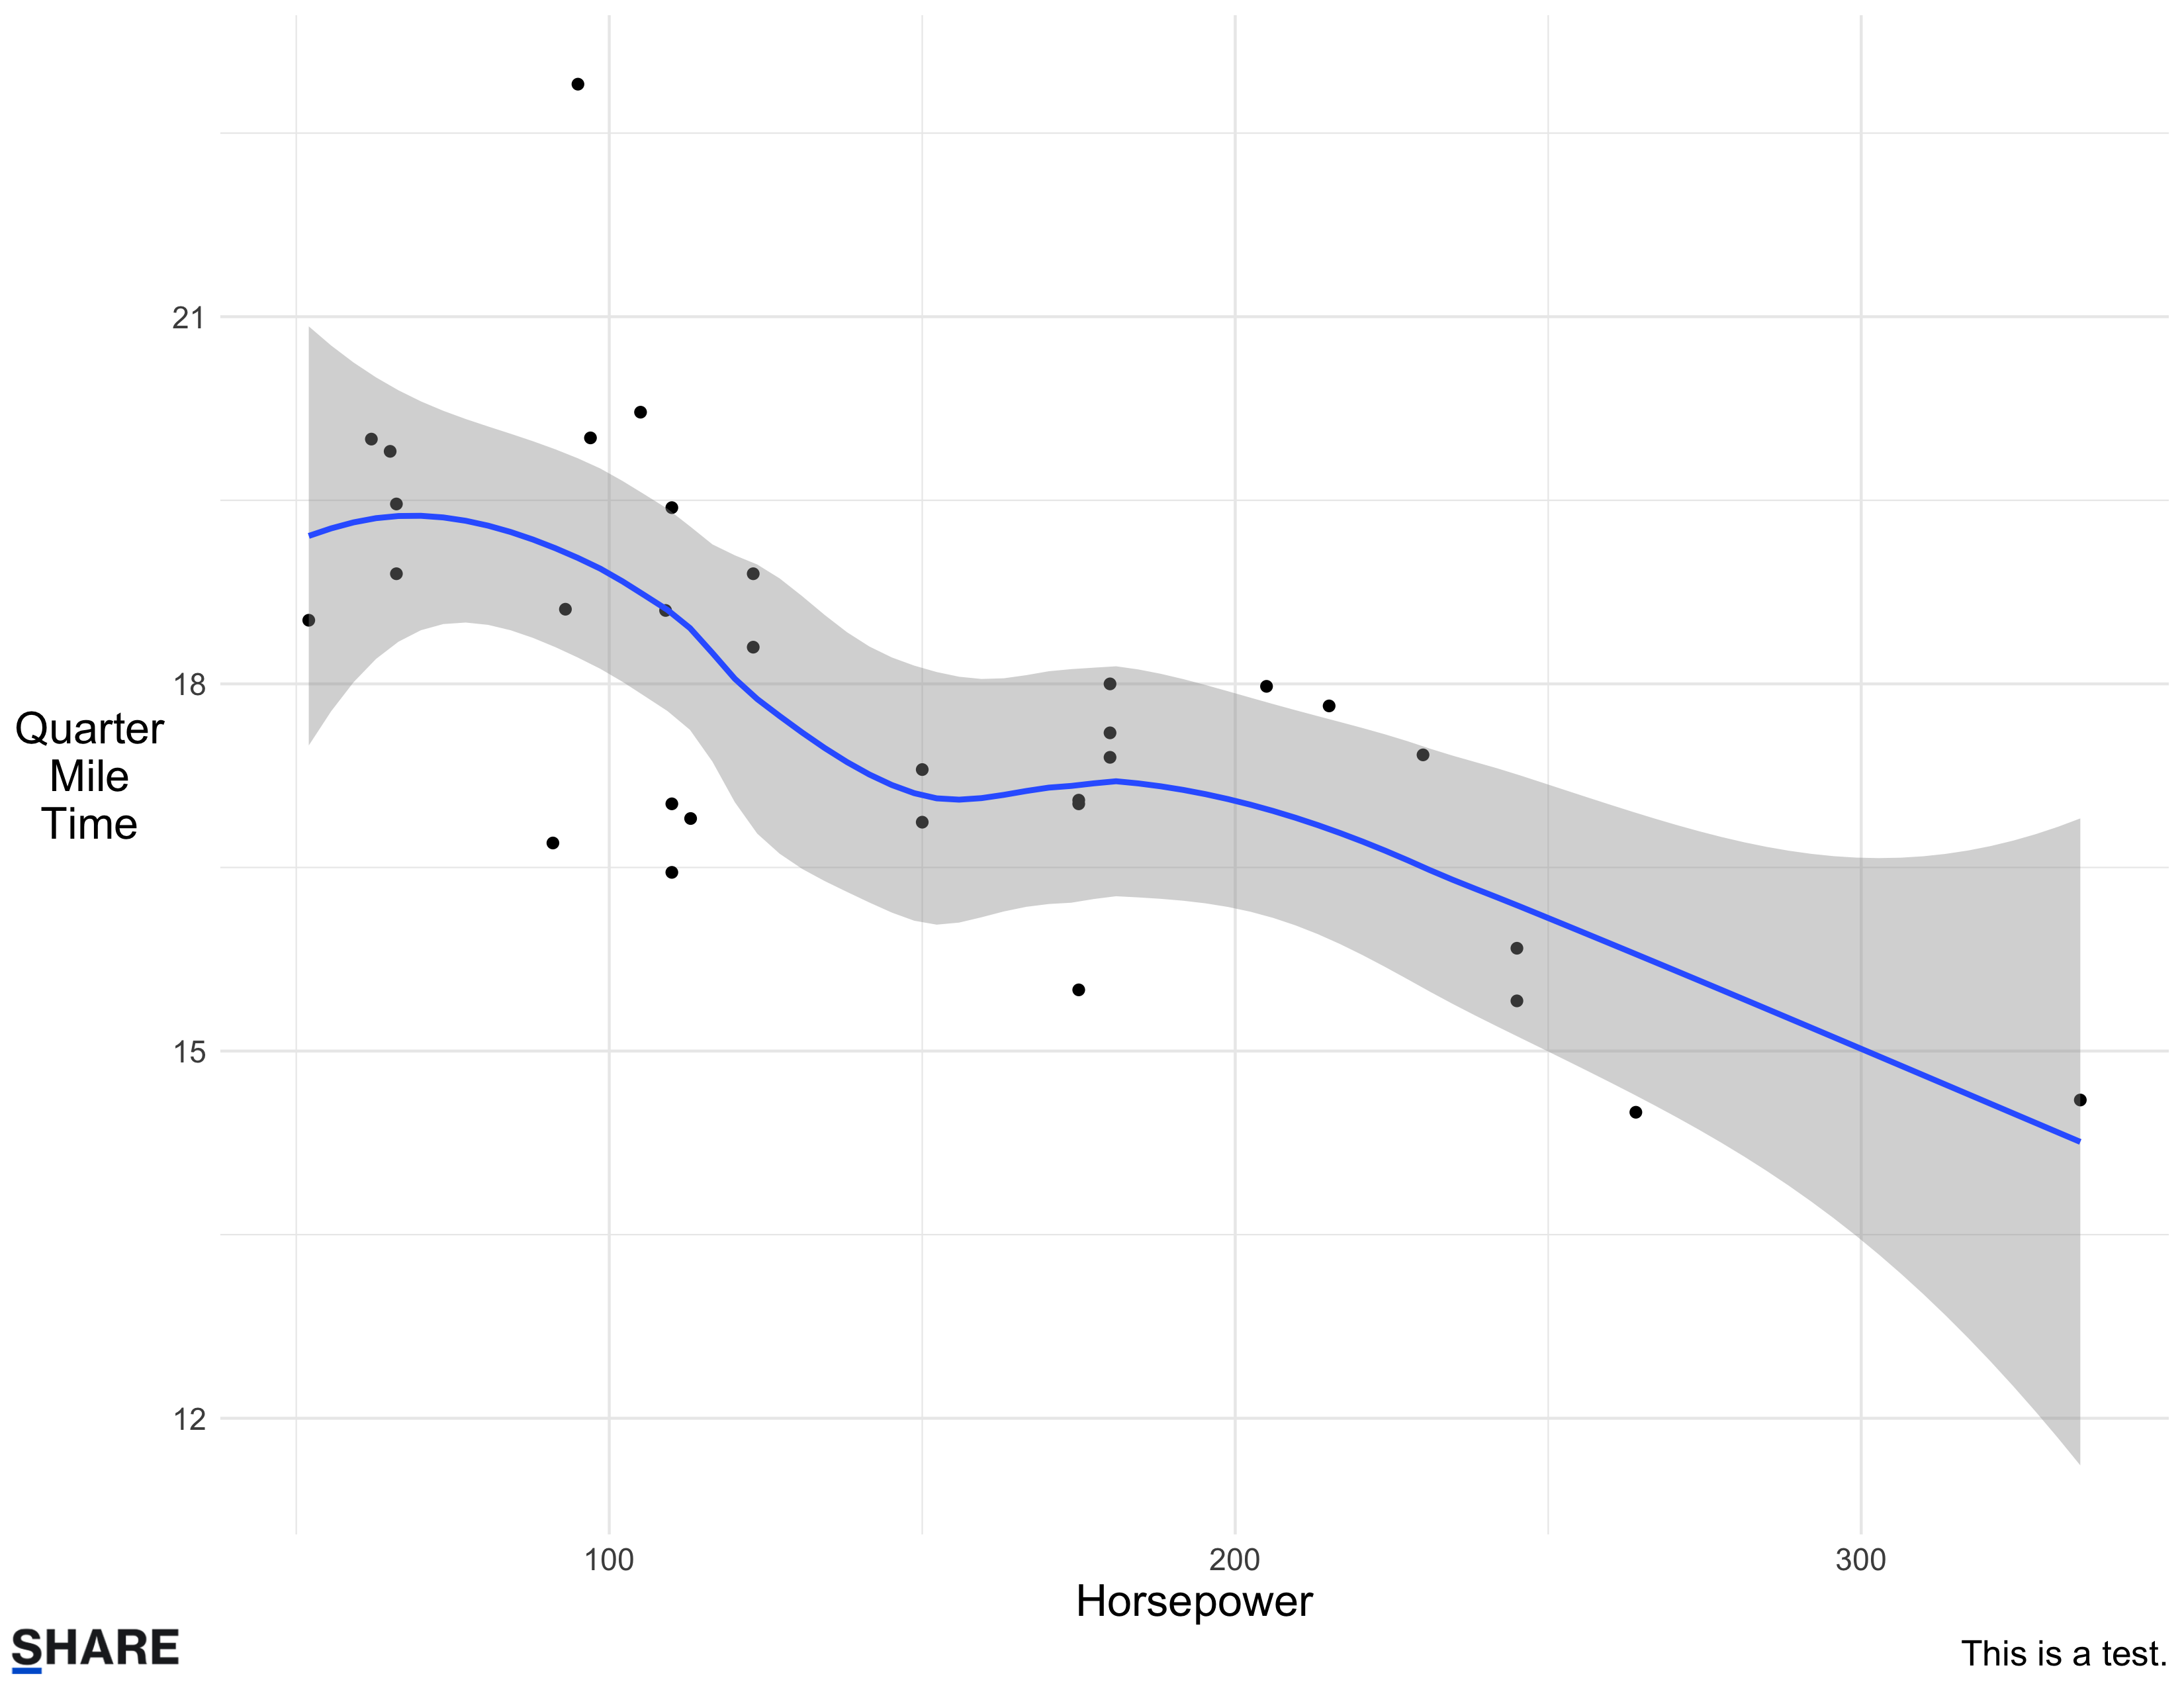
Add the SHARE logo
Running the following code will save an image with the Microsoft logo
in the "viz/" folder in the user’s project directory.
add_logo(plot = test_plot,
         logo = "share",
         caption = "This is a test.",
         filename = "test_share.png",
         path = "viz/")
It would look like this:

Add client logos
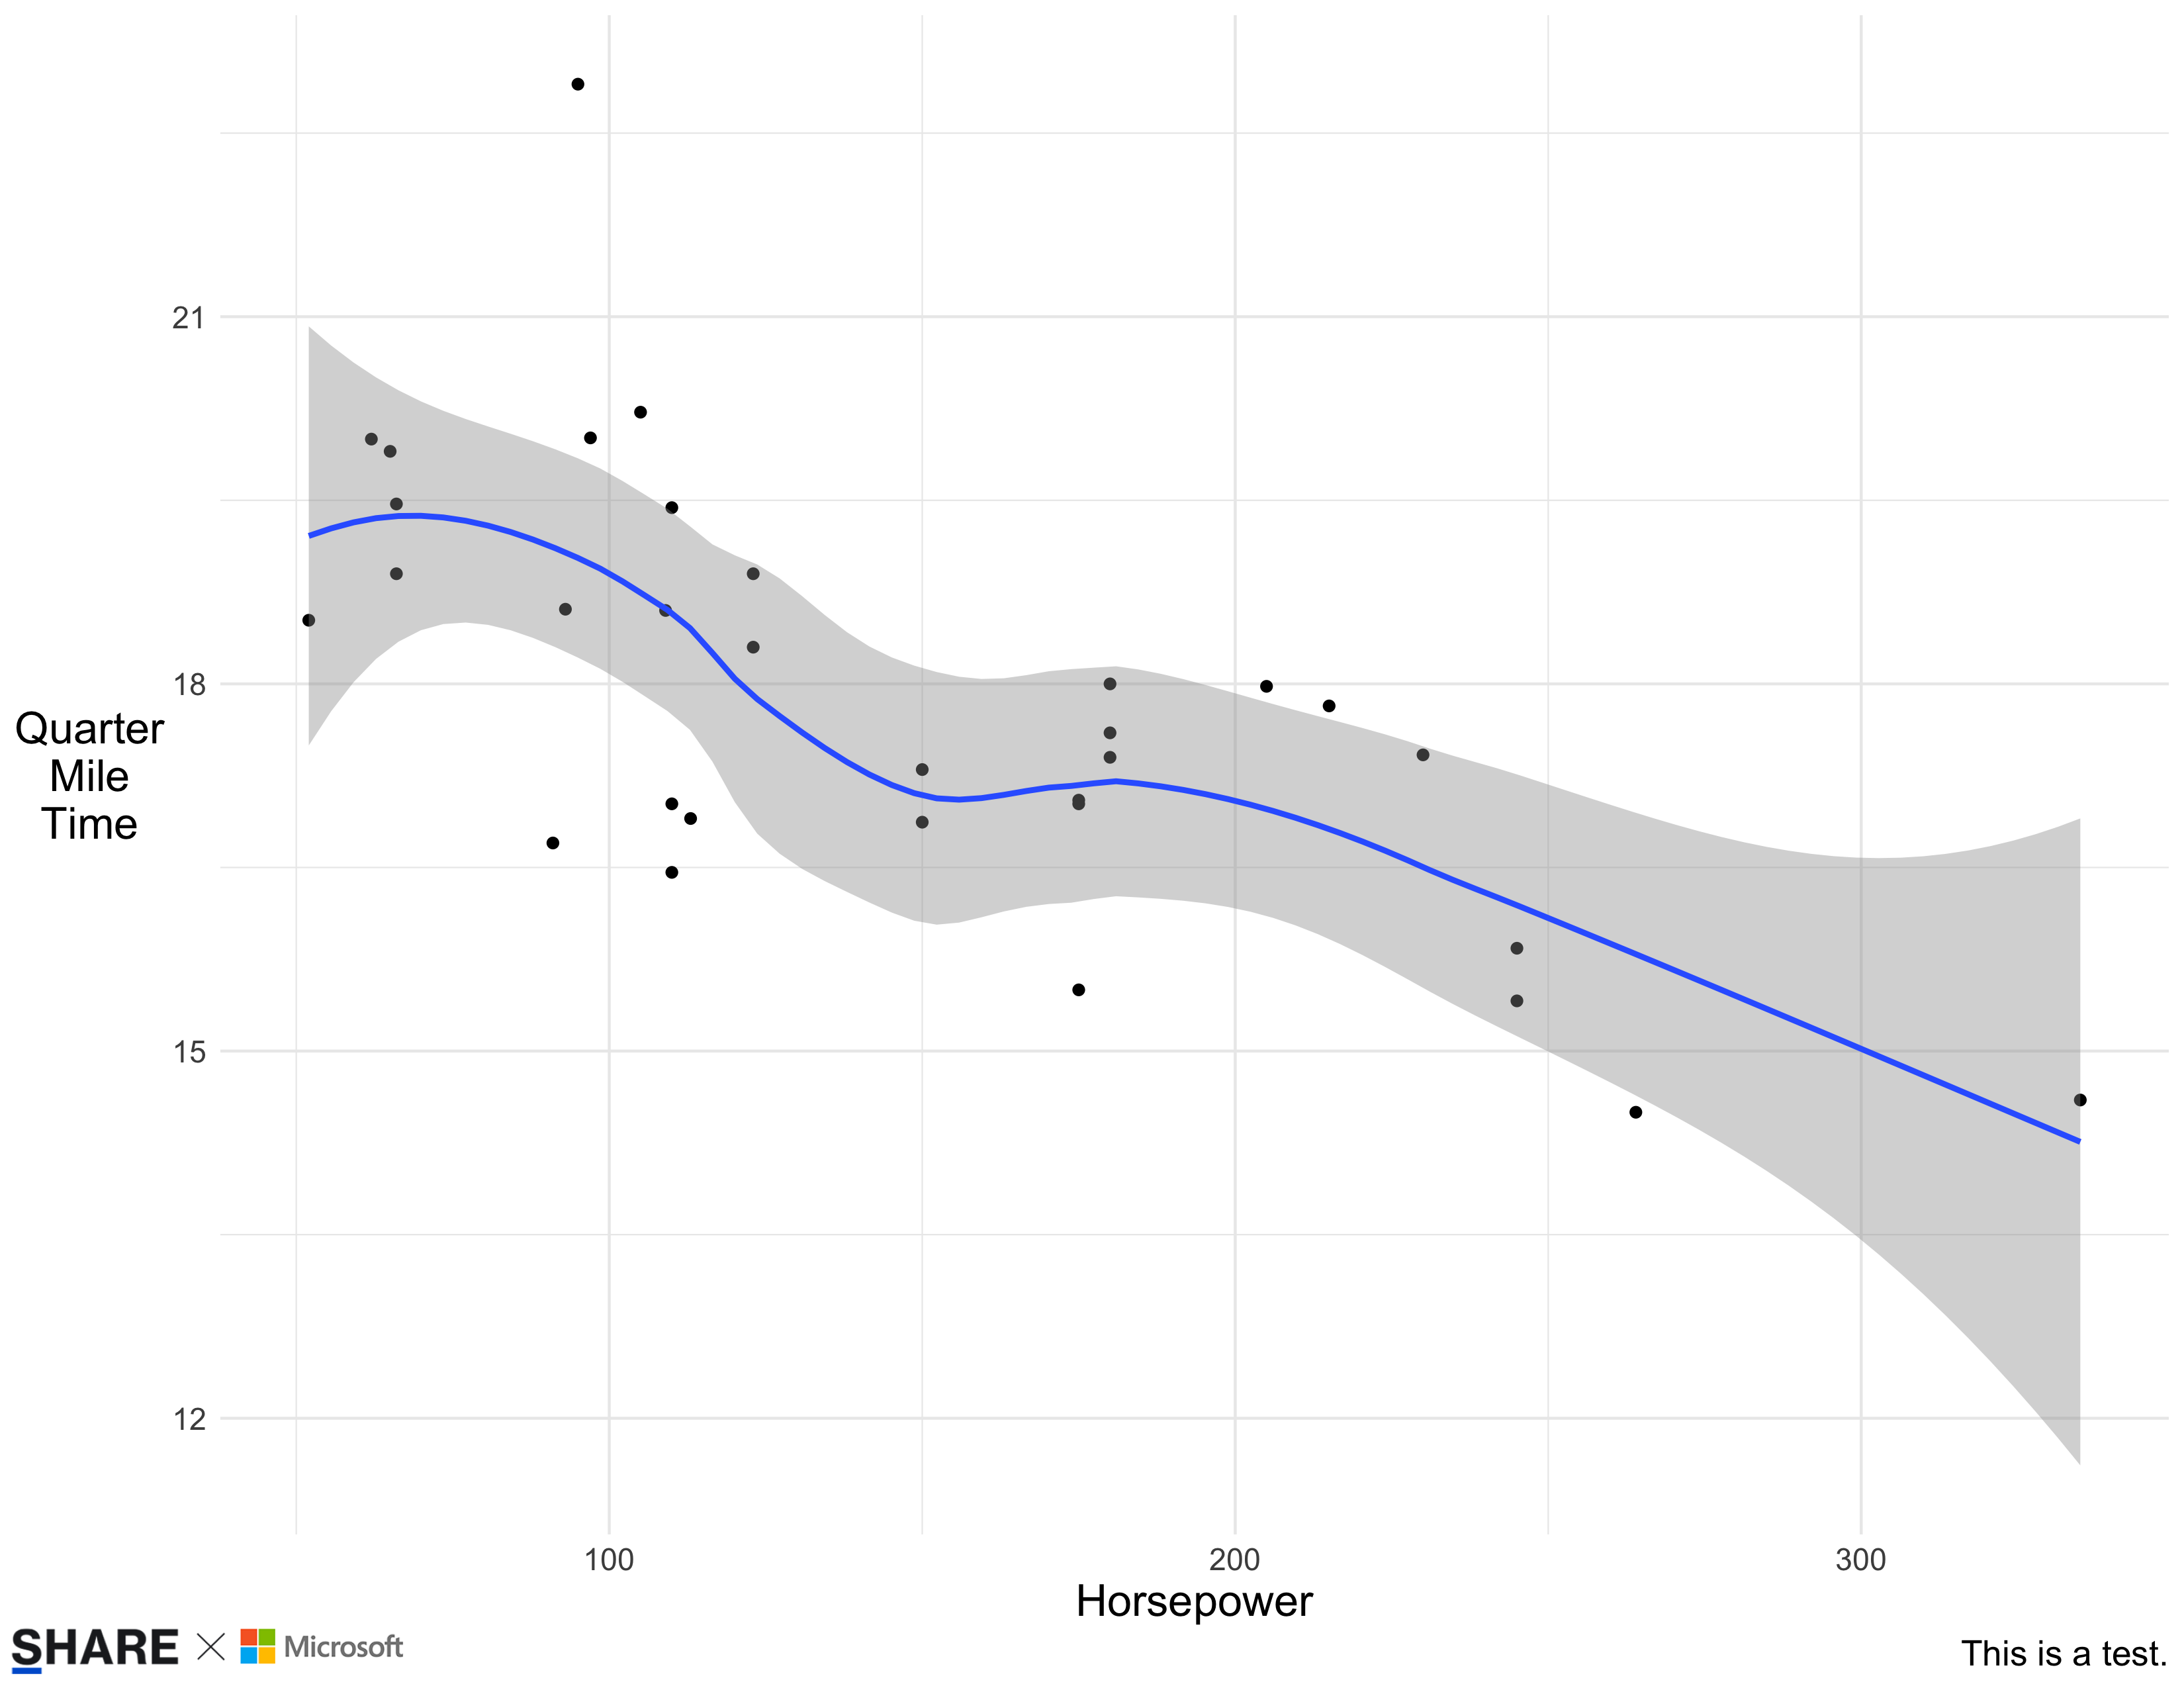
Microsoft
Running the following code will save an image with the Microsoft logo
in the "viz/" folder in the user’s project directory.
add_logo(plot = test_plot,
         logo = "microsoft",
         caption = "This is a test.",
         filename = "test_microsoft.png",
         path = "viz/")
It would look like this:

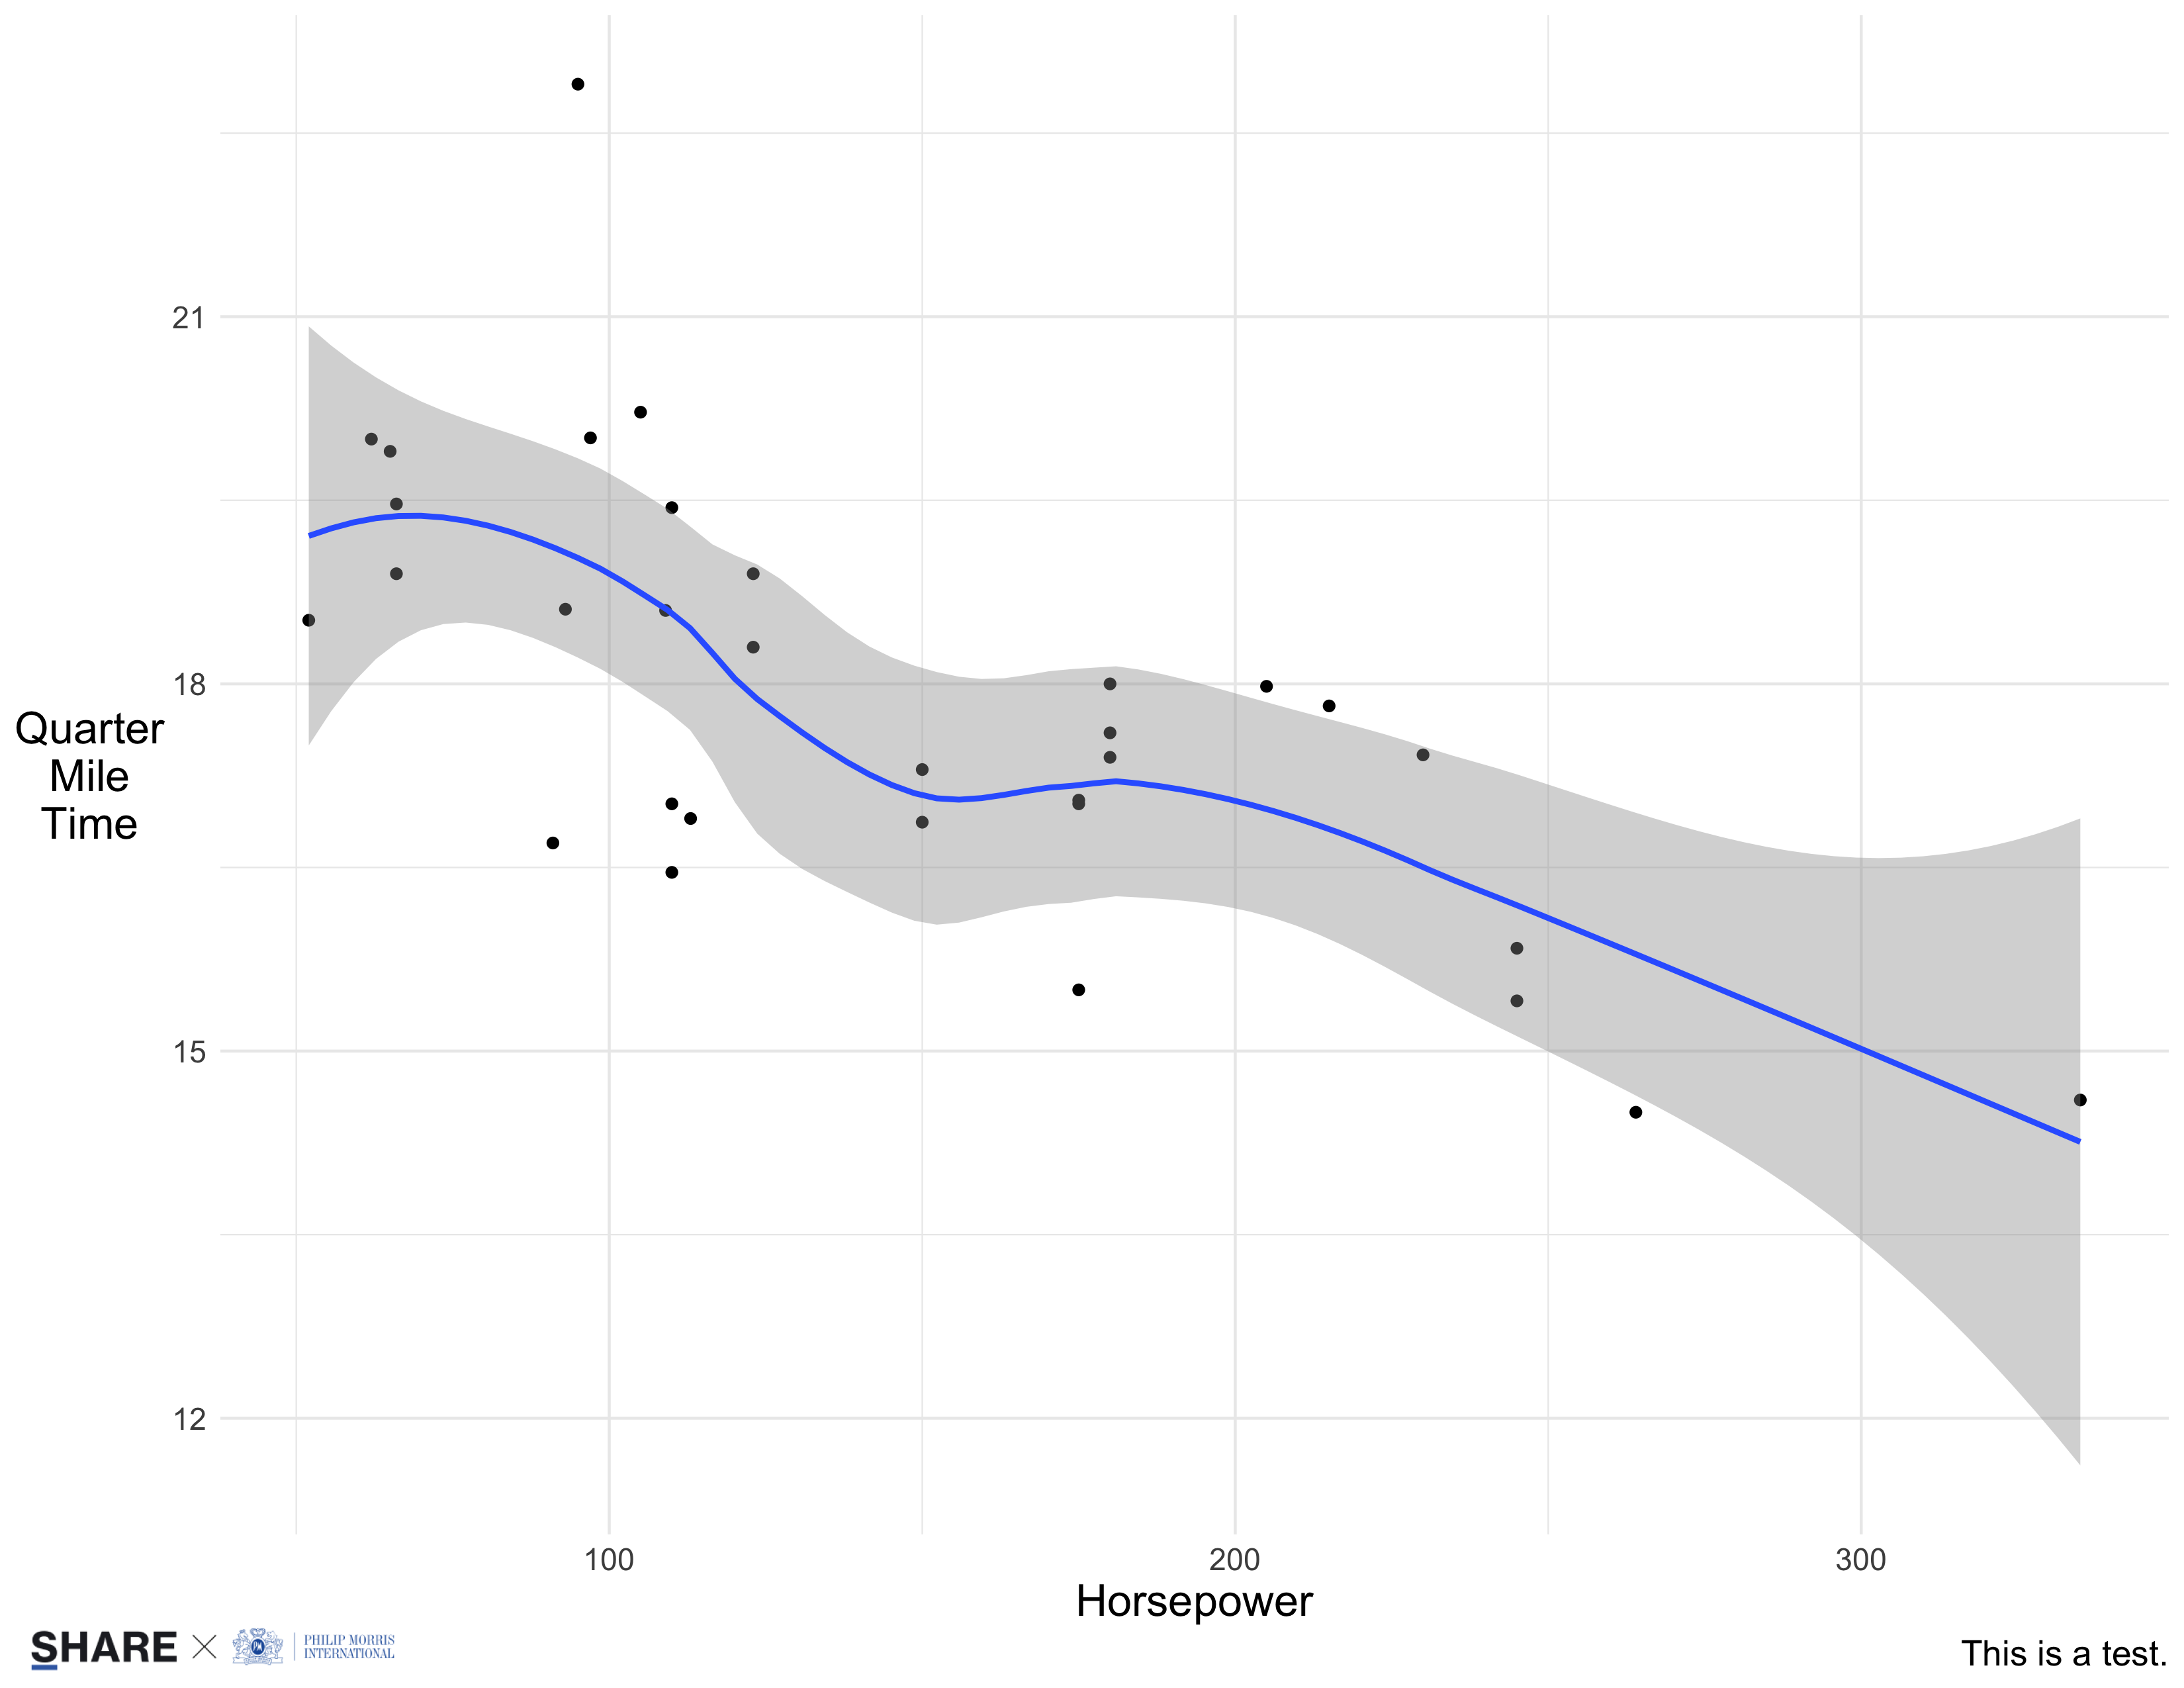
PMI
Running the following code will save an image with the PMI logo in
the "viz/" folder in the user’s project directory.
add_logo(plot = test_plot,
         logo = "pmi",
         caption = "This is a test.",
         filename = "test_pmi.png",
         path = "viz/")
It would look like this:

A new client
We can easily add new logos by including them as a .png file in the
logos
folder in the GitHub repo.
If the file that was added was “new_logo.png”, then to use this logo
provide logo = "new_logo" as an argument to the
add_logo function.
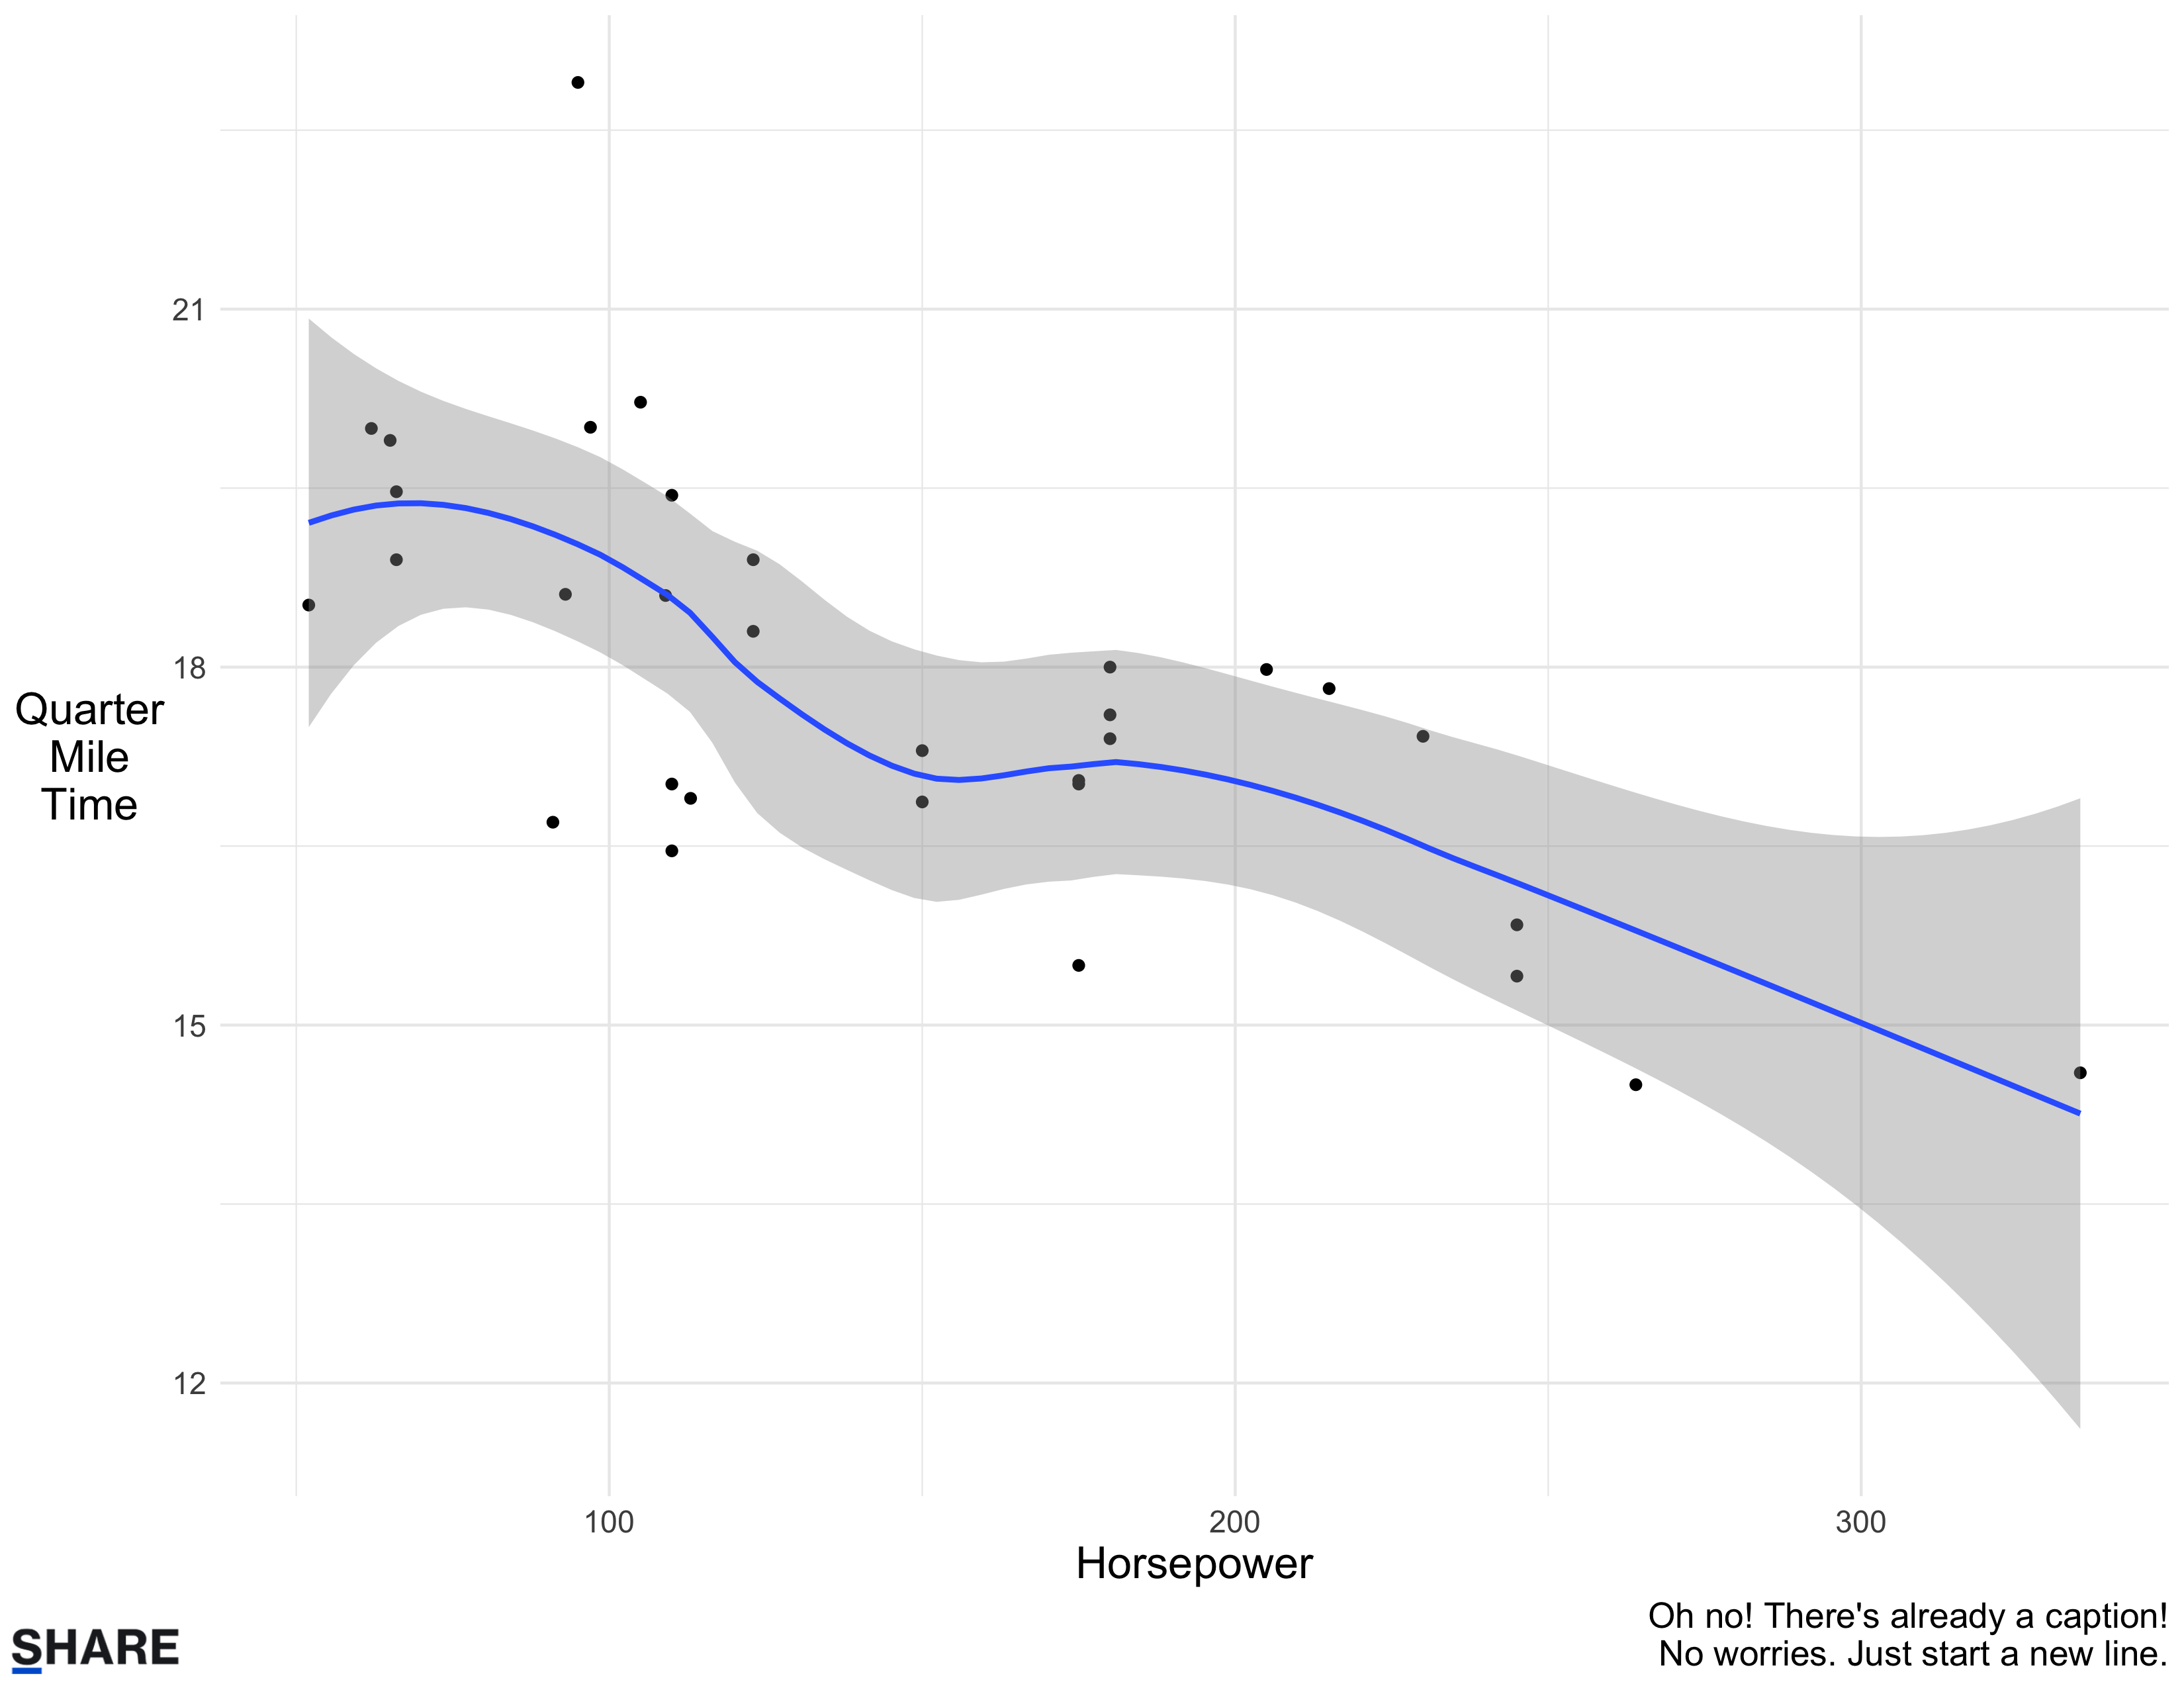
What if there’s already a caption?
Sometimes our plot might already have a caption.
caption_plot <- test_plot +
  labs(caption = "Oh no! There's already a caption!")

caption_plot
We can still add an extra caption within the add_logo
function by starting our caption string with
"\n" to start a new line.
add_logo(plot = caption_plot,
         logo = "share",
         caption = "\nNo worries. Just start a new line.",
         filename = "extra_caption_share.png",
         path = "viz/")