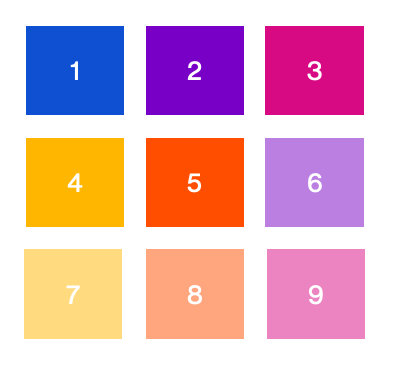
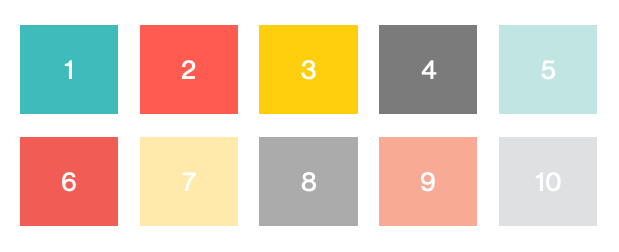
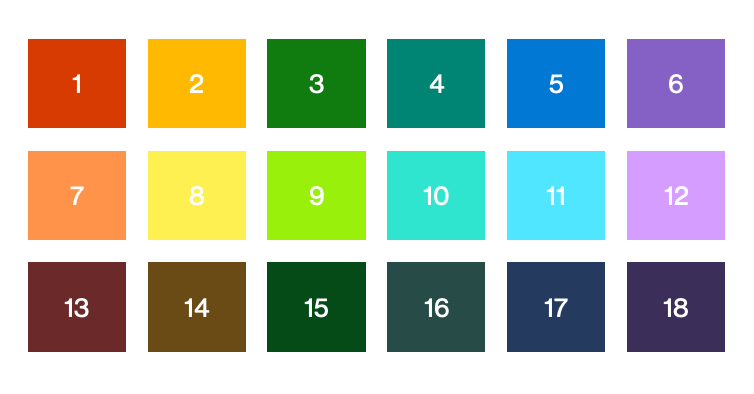
This article provides examples of how the theme...()
functions can be used.
When preparing a deck, either in-house or for clients, using the right colours and font makes the presentation more refined. Currently we have the ability to change the theme of plots so they are in-line with Microsoft, SHARE, and Samy. We can also change the plot from light to dark, which is useful in situations where slides are black.
Discrete plots
First, we’ll make an example plot using ParseR’s
sprinklr_export dataset. Let’s see how many posts are
negative, neutral, or positive across each of the social networks.
test_data <- ParseR::sprinklr_export %>% sample_n(1000)
test_data_sentiment <- ParseR::score_valence(test_data, valence_limits = c(-1,1))
The original plot:
test_plot <- test_data %>%
  dplyr::count(SocialNetwork, Sentiment) %>%
  ggplot2::ggplot(ggplot2::aes(Sentiment, n, fill = Sentiment)) +
  ggplot2::geom_col(show.legend = F) +
  ggplot2::facet_wrap(~SocialNetwork, scales = 'free_y') +
  ggplot2::ylab('Post Count')

test_plot + ggplot2::theme(axis.text.x = element_text(angle = 45, vjust = 0.5, hjust=0.5))
SHARE theme
test_plot + HelpR::theme_share(scale_type = "discrete", index = NULL) +
  ggplot2::theme(axis.text.x = element_text(angle = 45, vjust = 0.5, hjust=0.5))
Samy theme
Here we have chosen the colour indices to change the plot from the default settings.
test_plot + theme_samy(scale_type = "discrete", index = c(7,4,5)) +
  ggplot2::theme(axis.text.x = element_text(angle = 45, vjust = 0.5, hjust=0.5))
Microsoft theme
test_plot + HelpR::theme_microsoft(scale_type = "discrete",index = NULL) +
  ggplot2::theme(axis.text.x = element_text(angle = 45, vjust = 0.5, hjust=0.5))
Black theme:
test_plot + HelpR::theme_microsoft(scale_type = "discrete", index = NULL) +
  HelpR::theme_black() +
  ggplot2::theme(axis.text.x = element_text(angle = 45, vjust = 0.5, hjust=0.5))
Continuous plots
Now let’s have a look at how we can apply the themes for continuous data. We can look at the sentiment across posts for each platform.
The original plot:
test_plot <- ParseR::valence_compare(test_data_sentiment, SocialNetwork)

test_plot$distributions
SHARE theme
test_plot$distributions + HelpR::theme_share(scale_type = "continuous", index = NULL,
                                                        direction = 1,
                                                        guide = F)
Samy theme
Here we have chosen the colour indices to change the plot from the default settings.
test_plot$distributions + HelpR::theme_samy(scale_type = "continuous", index = c(1:4),
                                                       direction = -1,
                                                       guide = F)
Microsoft theme
test_plot$distributions + HelpR::theme_microsoft(scale_type = "continuous",index = NULL,
                                                            direction = 1,
                                                            guide = F)
Black theme:
test_plot$distributions + HelpR::theme_microsoft(scale_type = "continuous",index = NULL,
                                                            direction = 1,
                                                            guide = F) +
  HelpR::theme_black()


