This article plays through an exemplar workflow for creating a network of retweets.
- This can be used to try to find important authors and amplifiers.
We’ll use the example data in the ConnectR package.
example <- ConnectR::retweet_exampleCreate the network
retweet_graph <- example %>%
  ConnectR::make_retweet_network(from = OriginalAuthor,
                                 to = sender_handle,
                                 size = followers,
                                 colour = Score)
Visualise the network
Interactive
The default visualisation is interactive. You can:
- Hover over a node to highlight its connections, name, and follower count.
- Hover over an arrow to see how many retweets it represents.
- Zoom in or out to see all the names for a collection of nodes.
- Use the “edit” button to remove irrelevant nodes and edges.
- Double click on a node to collapse all its edges.
- Click and drag the nodes to make the layout clearer.
- Search for a particular author in the dropdown menu.
ConnectR::viz_network(tbl_graph = retweet_graph)Static
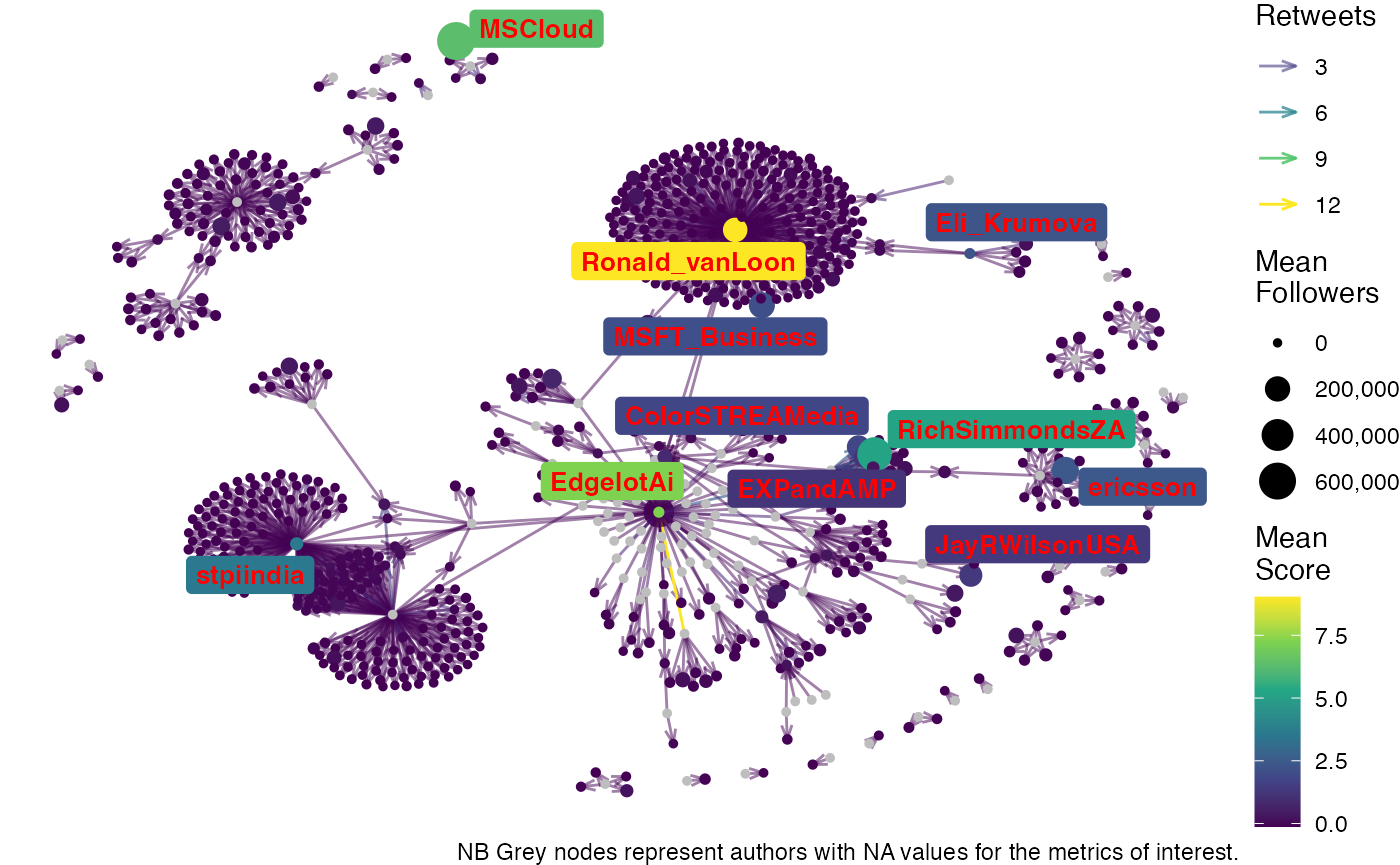
It’s also possible to create a static visualisation of the network in case this is necessary.
ConnectR::viz_network(tbl_graph = retweet_graph,
                      type = "static",
                      label_prop = 0.01)