ParseR combines functionality from the widyr package
and the tidygraph
package to enable users to create network visualisations of the
pairwise correlations with specified terms.
We’ll play through an example using a sample of the data set included in the ParseR package.
# Generate a sample
set.seed(1)
example <- ParseR::sprinklr_export |>
  dplyr::slice_sample(n = 1000)
N.B. The function dplyr::slice_sample(n = 1000)
is only used in this tutorial to speed up the analysis and workflow, a
sample of 1000 should NOT be taken during project work. If you have any
worries with the size of data or speed of analyses speak to one of the
DS team.
Calculate the pairwise correlations
Each post will be broken down into individual words, then the words whose occurrence is correlated with terms that we’re interested in will be returned.
- The correlation we’re calculating and using here is called the phi coefficient and is denoted by .
- It’s a measure of association for two binary variables.
- For a pair of words we can interpret it as how much more likely it is that both or neither of the words appear in a document than that either one appears alone.
- For more information check out either tidytextmining or wikipedia.
corrs <- ParseR::calculate_corr(
  # We must specify the data set we're using
  df = example,
  # We must specify the text variable in our dataset
  text_var = Message,
  # We must specify terms we're interested in
  terms = c(
    "hispanic", # Can use single words
    "hispanic heritage", # Can use multi-word phrases (e.g. brands, names)
    "#hispanicheritagemonth"
  ), # Can use hashtags
  # We can specify a minimum term frequency
  min_freq = 25,
  # We can specify correlation limits
  corr_limits = c(0, 1), # E.g. We only want positive correlations
  # We can specify the top_n correlations to include
  n_corr = 50,
  # We can specify whether to include hashtags in the text
  hashtags = TRUE,
  clean_text = TRUE
) # clean the text variable in place
Note that corrs is a list object:
class(corrs)## [1] "list"It contains two objects:
- “view”
- A human-readable tibble with the top correlations involving our terms of interest.
corrs |>
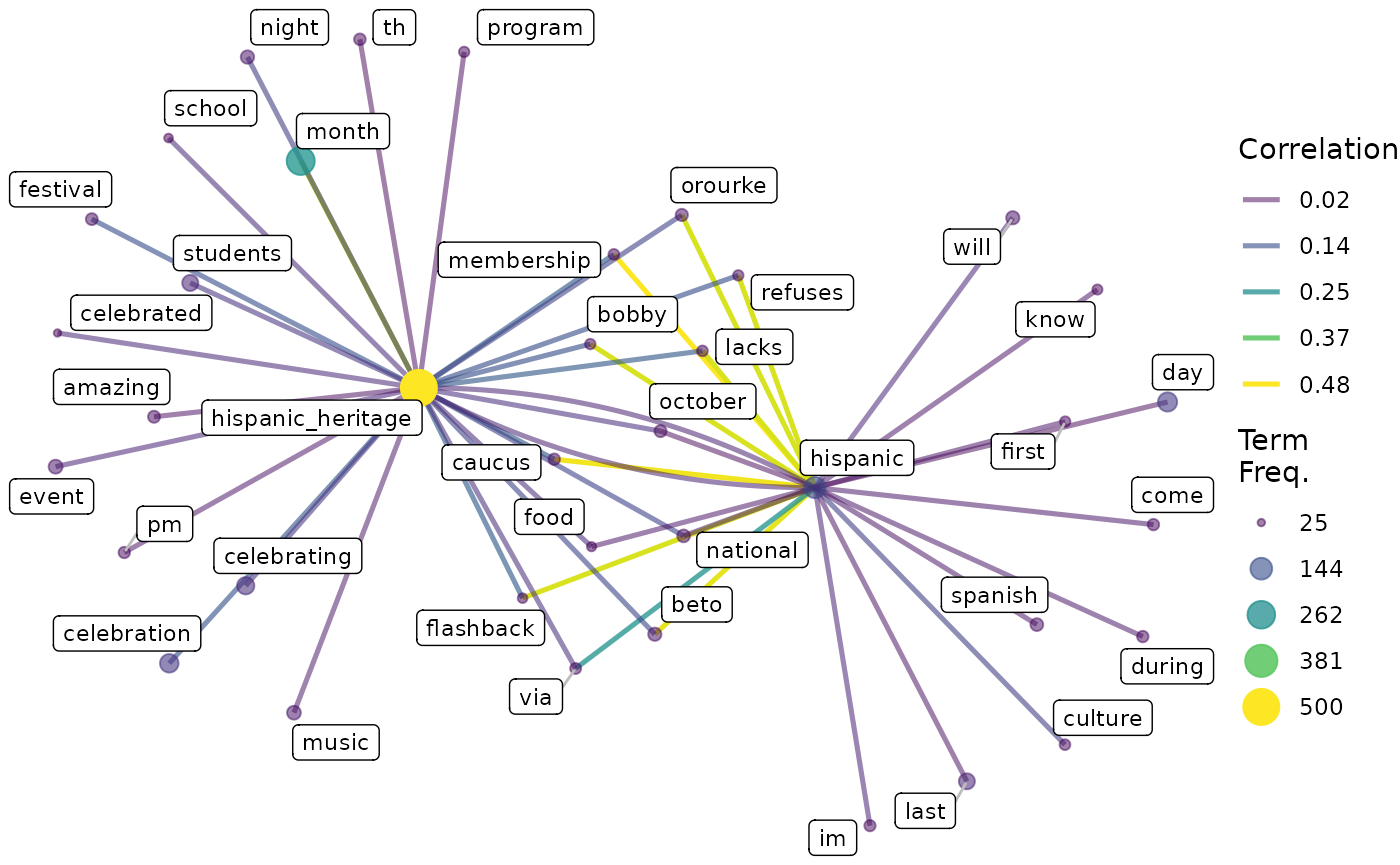
purrr::pluck("view")## from to correlation
## 1 hispanic membership 0.48336958
## 2 hispanic caucus 0.47323706
## 3 hispanic beto 0.46570034
## 4 hispanic flashback 0.45665352
## 5 hispanic refuses 0.45568694
## 6 hispanic bobby 0.45568694
## 7 hispanic lacks 0.45568694
## 8 hispanic orourke 0.45541940
## 9 hispanic_heritage month 0.44894833
## 10 hispanic via 0.25986127
## 11 hispanic_heritage flashback 0.15972602
## 12 hispanic_heritage membership 0.15568946
## 13 hispanic_heritage lacks 0.15264869
## 14 hispanic_heritage caucus 0.15238955
## 15 hispanic_heritage celebration 0.14596506
## 16 hispanic_heritage refuses 0.13976375
## 17 hispanic_heritage bobby 0.13976375
## 18 hispanic_heritage festival 0.13700806
## 19 hispanic_heritage beto 0.12160149
## 20 hispanic_heritage national 0.11715236
## 21 hispanic_heritage orourke 0.11599078
## 22 hispanic culture 0.11085574
## 23 hispanic_heritage night 0.10954845
## 24 hispanic_heritage celebrating 0.09463453
## 25 hispanic_heritage students 0.08799256
## 26 hispanic_heritage october 0.08361897
## 27 hispanic_heritage via 0.07959053
## 28 hispanic_heritage food 0.07575212
## 29 hispanic_heritage school 0.07575212
## 30 hispanic_heritage event 0.07039498
## 31 hispanic will 0.06670568
## 32 hispanic_heritage celebrated 0.06622076
## 33 hispanic im 0.06448052
## 34 hispanic_heritage hispanic 0.06021782
## 35 hispanic hispanic_heritage 0.06021782
## 36 hispanic national 0.05941166
## 37 hispanic_heritage music 0.04788759
## 38 hispanic come 0.04561321
## 39 hispanic during 0.04561321
## 40 hispanic spanish 0.04268974
## 41 hispanic food 0.03932999
## 42 hispanic first 0.03932999
## 43 hispanic know 0.03932999
## 44 hispanic_heritage pm 0.03854528
## 45 hispanic last 0.03695883
## 46 hispanic_heritage program 0.03269195
## 47 hispanic day 0.03206468
## 48 hispanic_heritage amazing 0.02852779
## 49 hispanic october 0.02511769
## 50 hispanic_heritage th 0.02379925- “viz”
- A
tbl_graphobject that can be used to produce a network visualisation.
corrs |>
  purrr::pluck("viz")
## # A tbl_graph: 38 nodes and 50 edges
## #
## # An undirected multigraph with 1 component
## #
## # Node Data: 38 × 2 (active)
## word term_freq
## <chr> <int>
## 1 hispanic 133
## 2 membership 31
## 3 caucus 34
## 4 beto 44
## 5 flashback 28
## 6 refuses 30
## 7 bobby 30
## 8 lacks 31
## 9 orourke 38
## 10 hispanic_heritage 500
## # ℹ 28 more rows
## #
## # Edge Data: 50 × 3
## from to correlation
## <int> <int> <dbl>
## 1 1 2 0.483
## 2 1 3 0.473
## 3 1 4 0.466
## # ℹ 47 more rowsVisualise the network
Now we can use the tbl_graph object we generated using
calculate_corr() to produce a network visualisation.